Home > Highlighting JAPAN > Highlighting Japan March 2018 > Technologies for Disaster Mitigation
Highlighting JAPAN
Real-time Risk Maps for Disaster Prevention
In July 2017 the Japan Meteorological Agency (JMA) started to provide “Real-time Risk Maps” showing the levels of risk of inundation, floods and landslides to help prevent water-related disasters.
According to rainfall trend analysis, the number of concentrated and torrential rainfall events is increasing year by year over Japan, and water related disasters occur every year. In response, JMA has been made efforts to develop weather information for disaster prevention.
Yasunobu Takagi, a Senior Forecaster in JMA’s Forecast Department, says, “JMA has been issuing Advisories, Warnings and Emergency Warnings, and such information is now issued for each area of a municipal government all over Japan. However, there were voices asking for more detailed information about where the risk is in the area and what its level is both from residents and the local government officials who are responsible for issuing evacuation recommendations and orders to the residents. In response to these voices, JMA started to provide information in the “Real-time Risk Maps” in July 2017.”
The Real-time Risk Maps show risk levels in colors on a scalable map all over Japan with a mosaic pattern for landslides and inundation, and with river flow paths for flood disasters, and enable viewers to recognize easily the location of risks and their levels. This detailed risk information is generated by using collected rainfall observations, analyzing and forecasting rainfall distributions, simulating the flow of water under the ground and through rivers, and evaluating risk levels associated with past disaster events. The rainfall distributions can now be observed accurately by the developed weather radar network across Japan. However, it must be acknowledged that water-related disasters occur owing to many factors including landforms and geology, and are not related directly with the amount of rainfall. Simulating the flow of water under and on the ground and through rivers, three types of indices are computed, such as soil water index (amount of rain soaking and accumulating in soil), surface water index (amount of rain remaining and accumulating on the surface of the ground) and runoff water index (amount of rain gathering from headwaters and running through rivers). Then, risks are evaluated in advance in five levels by comparing the computed indices with thresholds statistically determined for each grid point from the past disaster data of twenty-five years. The risk levels are displayed on the “Real-time Risk Maps” for landslide, inundation and flood respectively and updated every ten minutes.
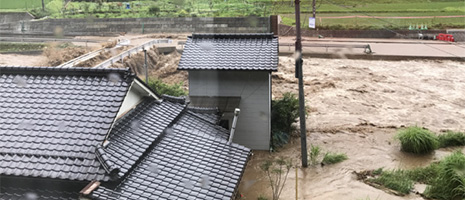
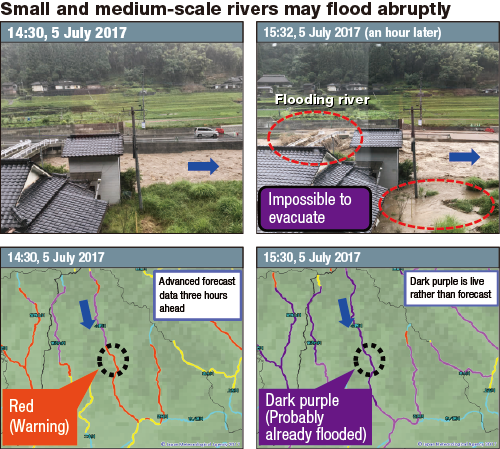
Takagi says that he would like to ask people to pay particular attention to the Real-time Flood Risk Map among the three. In Japan, there are many small and medium-scale rivers with narrow width, and their flows are steep in mountain areas. When it rains heavily over the upper areas of a river, the flood risk of the river rapidly increases in a short period of time, and could be deadly for residents who fail to escape from buildings submerged.
“Before, river flood forecasts were only conducted for large-scale rivers and based on real-time water height observation data,” says Takagi. “Meanwhile, the Real-time Flood Risk Map focuses on small and medium-scale rivers, whose water height increases rapidly but where water height observations are very limited. The Map provides risk information taking into account future risks three hours ahead, enabling people to evacuate from the rapid increase of water in advance. There are five color levels shown in the Map. Light blue means that the river is at the lowest risk level but asks people to pay attention to future information. Yellow means at the advisory risk level. Red means at the warning level. Light purple means a risk level higher than the warning level indicating a very dangerous situation is forecasted. Dark purple means at the highest risk indicating the river would have already flooded, houses and roads would have been surrounded by water, and people might have lost a chance to evacuate. Therefore, referring to water level observed information if obtained, people are expected to evacuate at the light purple risk level, and elderly people are expected to evacuate at the red, To save lives in such disasters, JMA expects people individually to know the risks and make decisions to act to protect themselves. To support people more, JMA will make continuous efforts to provide more accurate forecasts and to provide weather related information more clearly and recognizably.”
Simple and essential information such as the Maps is expected to be effective in saving lives in the event of a disaster. Providing the Real-time Risk Maps, JMA expects people to raise their awareness about flood risk and consciousness about disaster prevention.


No article or any part there of may be reproduced without the express permission of the Cabinet Office. Copyright inquiries should be made through this form.
© 2009 Cabinet Office, Government of Japan